
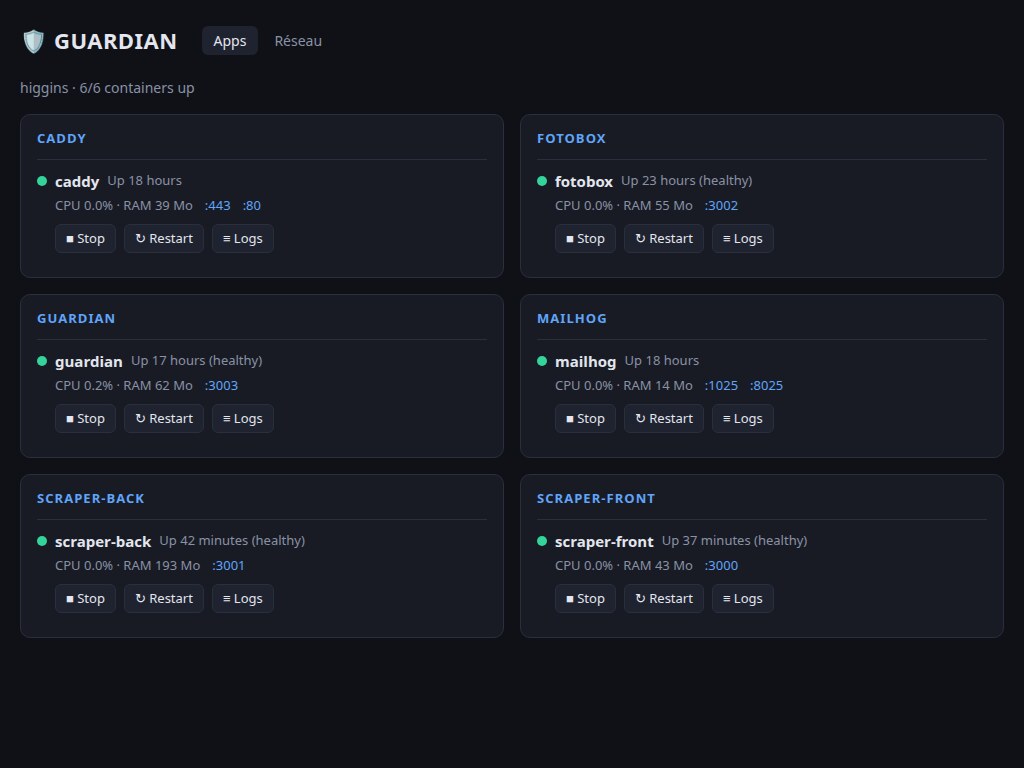
When the homelab grows, SSH stops being enough
My homelab is called higgins. It is a MacBook Pro M3 converted into a 24/7 server, a setup I described in a previous article. Since then, it has been busy: a prospecting scraper with its front and back end, a family photo app, a test mail server, a Caddy reverse proxy. Six Docker containers running around the clock.
And with six containers, a new problem appears: supervision. Knowing whether everything is up, why a service stopped responding, reading the logs of a container that crashes on startup. Until now, my answer was SSH. A connection, a docker ps, a docker logs -f, a docker compose restart. It works, but it assumes you are sitting at a terminal. From the couch, from a phone, from a client's office, that's a no.
I needed a dashboard. A web page that shows the state of everything and lets me act: start, stop, restart, read logs live.
The Portainer reflex, and why I did not follow it
The standard answer to this need exists, and it is called Portainer. It is an excellent product, thousands of homelabs run on it. I did not install it, for three reasons.
My actual need covers 10% of Portainer. List the containers, see their health, CPU and RAM, restart them, read their logs. That is all. Portainer does that, plus stack management, volumes, registries, teams, permissions. That extra surface is something I will never use, yet I would have to maintain it, update it, and trust it.
A supervision dashboard holds every key. The tool that controls your containers has access to the Docker socket, and therefore to everything. For this particular brick, I prefer code I wrote myself and can read end to end, rather than a third-party product whose CVEs I have to track.
Custom-built barely costs anything anymore. It is the logical continuation of what I wrote in my self-hosting article: with AI assistants, a focused internal tool gets built in a few working sessions where it would have taken weeks three years ago. The "existing product vs custom" calculation has flipped. When the need is small and well defined, custom wins.
The result is called GUARDIAN. A full-stack Nuxt 4 app, running in a container like the others, supervising all the others.
The architecture: deliberately minimal
- Framework: full-stack Nuxt 4. Front end and API in a single container, same stack as the rest of the homelab.
- Docker access: dockerode on the mounted socket. The daemon's native API, no CLI to embed in the image.
- Real-time logs: SSE (Server-Sent Events). Unidirectional, goes through the reverse proxy with zero configuration.
- Database: none. All the state comes from the Docker API, why duplicate it?
- Authentication: basic auth at the Caddy level. Zero application auth code in phase 1.
The whole thing boils down to three flows:
- The front end polls the API every 5 seconds. The server asks the Docker daemon for the container list, inspects each one (health, restart policy, ports), and groups them by compose project. One card per application.
- CPU/RAM metrics come from a second endpoint, every 10 seconds, lazy-loaded.
- Actions (start, stop, restart) are plain POST requests to the Docker API, followed by an immediate refresh.
No WebSocket, no server-side state manager, no job queue. Deliberate polling on an internal dashboard used by one person.
Three problems more interesting than expected
A "simple" project always holds a few surprises. Three examples worth the detour.
Docker logs are a multiplexed binary stream
Naively, you expect the logs API to return text. In reality, when the container has no TTY allocated, Docker multiplexes stdout and stderr into a single binary stream: each frame starts with an 8-byte header indicating the source stream and the payload size. You have to demultiplex before sending anything to the browser.
On the front end, an EventSource receives the stream over SSE: the last 200 lines first, then continuous follow, with filtering and autoscroll. When the panel closes, the SSE connection closes and the server properly destroys the Docker stream. That lifecycle (open, follow, clean up) is the real subject of log streaming, much more than the display.
CPU stats take two seconds, and that is normal
First reflex when seeing the stats endpoint answer in 2 seconds: look for the bug. There is none. To compute a CPU percentage, the Docker daemon samples the counters twice, one second apart, per container. It is documented, it is incompressible.
So the answer is not to optimize, but to design the interface accordingly: container states display immediately, metrics arrive later, lazily, without blocking anything else. A good reminder that perceived performance is a design decision as much as a code one.
The stop button can saw off the branch it sits on
GUARDIAN runs in a Docker container, on the very daemon it controls. So the interface shows a "Stop" button for... GUARDIAN itself. Clicking it kills the dashboard, which then cannot restart itself, since it is off. Same problem but worse with Caddy: stopping it takes down every domain of the homelab, including the one serving the dashboard.
The fix is technically trivial (a reinforced confirmation on those two containers, and a rescue SSH command documented in the README), but the case is representative of a real class of problems: any administration tool that administers itself has blind spots. Better to identify them before clicking.
A mounted Docker socket is root: own your threat model
Let's be clear: mounting /var/run/docker.sock into a container is equivalent to granting root on the machine. Whoever controls the daemon controls the volumes of every app, can mount any host path, can run any image.
Rather than pretending it is harmless, the threat model is stated and owned:
- A single authenticated entry point: the dashboard domain goes through Caddy with basic auth, a strong generated password, bcrypt-hashed.
- LAN exposure only: no port forwarding on the router, nothing leaves the local network.
- Secrets out of the repo: the password lives in a file ignored by git and excluded from the deployment rsync.
- Reduced API surface: in phase 1, the API can only list, inspect, read logs and start/stop/restart. No exec into containers, no removal, no creation.
That last point matters most. The best protection against a dangerous endpoint is not writing it. The day the homelab is shared with third parties, hardening will be needed (application-level auth, network ACLs). That day has not come, and over-securing now would be speculative complexity.
Going further: the internet box inside the dashboard
Once the machinery is in place, extending it is cheap. Second tab of the dashboard: the local network. GUARDIAN is paired with my ISP box (a Freebox) through its local API, and lists every connected device: name, IP, MAC address, wifi signal, last activity. With the right permission, it can even block a device from the wifi in one click.
Pairing with a Freebox is a delightful little moment: the application requests a token through the API, and validation happens physically, by pressing the blinking button on the front of the box. Two-factor authentication where the second factor is "being in the living room".
In the same vein, the dashboard now manages per-device access to the other homelab apps. Since the Docker runtime's NAT masks client IP addresses (the reverse proxy sees the same IP for the whole LAN), filtering by IP is impossible. The solution: HMAC-signed enrollment cookies, checked by Caddy on every request via forward_auth, with an enrollment page served on each app's own domain. You switch an app to restricted access from the dashboard, effective immediately, with nothing to reload.
The detail that changes daily life: developing against real production
A Docker dashboard develops poorly against an empty local Docker. Since the socket is configurable through an environment variable, an SSH tunnel is enough to plug the local dev environment straight into the server's socket. The dashboard under development on the workstation then displays the server's real containers, their real metrics, their real logs.
No fixtures, no mocks, no staging environment to maintain. For an internal tool, it is the best comfort-to-cost ratio I know.
What this project illustrates
Beyond the homelab, this project is a textbook case of the custom internal tool:
- A precise need beats a generic product. GUARDIAN does exactly what I need, nothing else, and every line is readable.
- Phase 1 only does reads and reversible actions. Start, stop, restart, logs. Destructive operations will come later, or never.
- The existing infrastructure does the heavy lifting. Authentication is delegated to the reverse proxy, state lives in the Docker API, deployment reuses the existing rsync scripts. The application code only carries the added value.
The next step is already planned: triggering app rebuilds and redeployments straight from the interface, with the build output streamed over SSE, plus a deployment history. The streaming machinery is already in place, it just needs to be plugged into something other than logs.
If you run a small infrastructure (a homelab, an agency's servers, an SMB's application stack) and the off-the-shelf tools feel oversized, the question is worth asking: what if the exact tool you want could be built in a few days?
An internal tool, dashboard or custom supervision project? Let's talk. Tools cut to your actual need, without the complexity of generic products.